
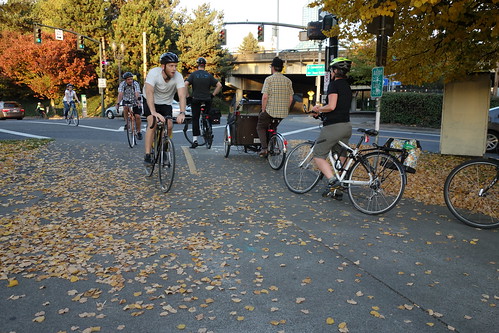
cc licensed ( BY NC SA ) flickr photo shared by Greg Raisman
Related Posts:
> See these blog categories: cycling benefits; saving money; saving time; convenience
> How to reduce your cycling operating costs to less than $150 per year
> Why Mr Money Mustache's biggest secret of financial freedom is to ride a bike
Details:
1. Overall Summary
The overall picture is perfectly clear: by cycling for transport I make massive gains in money, time, convenience, safety, health and enjoyment.
| Benefit (compared to driving) | 2014 (Jan - Dec) |
|---|---|
| Money Saved | A$4,000 - A$5,000 |
| Transport Time Saved | ~90 hours |
| Wasted Time Saved | ~313 hours |
| Trip Convenience Satisfaction | 99% |
| Safety | 0 accidents, injuries, near misses |
| Health | 0 issues, sick days, doctor visits |
| Trip Enjoyment Rating | 99% were enjoyable |
| Trips under 20km I chose not to cycle | 1 nightime roundtrip to a party |
| Total cycling km | ~4,000km |
I don't have rare circumstances or skills that makes these gains difficult to replicate by the vast majority of able-bodied adults. However, your current circumstances and lifestyle will likely need to be proactively redesigned to maximise the benefits of switching to cycling and prioritising your quality of life. Most residents of Melbourne (or similar cities) could also cycle for at least some of their trips and start redesigning their lives and taking advantage of these benefits. If you own a car, the biggest gains are realised when you eventually get rid of it and come to depend on cycling and walking as your primary means of local transport.
Also there are various practical barriers, issues and challenges to be overcome or optimised over time. These all differ according to each circumstance, so it's up to each individual or family to assess and solve these. This blog exists to help you do that. Simply choose the relevant category to review these solutions. E.g. barriers and solutions; buying a bike and gear; safety and health; routes and maps; protecting your bike; how to ride; commuting; comfort; etc.
Notes:
The scope of this analysis is local trips - defined here as trips between 2km and 20km. The vast majority of people's local trips are under 20km (over 99% of mine are). I exclude trips under 2km as I tend to walk most of them (which is even better than cycling for short trips).
I don't own or have access to a car. I didn't use cars for any local trip in 2014 (including taxis, Uber, etc). I have very good access to public transport (2 tram lines are 300-400m away, the train is 1km away) but use it very rarely as I prefer to cycle. However, there are situations where public transport is a necessary or superior alternative. See: The most common situations where a public transport alternative helps cyclists
2. Money Saved
Regarding the financial benefits, the calculations are dead simple:
(a) My direct operating expenditures on cycling in 2014 were $0. I do all maintenance myself and didn't have any servicing, part replacement or running costs. You could claim that food is a running cost but I doubt I'd save much money if I switched to a passive mode of transport; I think I'd eat about the same and just put on weight due to getting insufficient exercise. As the saying goes: "cycling runs on fat and saves you money; driving runs on money and makes you fat."
See: How to reduce your cycling operating costs to less than $150 per year.
So that just leaves the amortized operating expenses that I estimate at $138/year - $75/year of which is purely the depreciation of my bike over an artificially-shortened 5 year period (its lifespan is around 15 years but I will buy a new bike approximately every 5 years because I want to and can easily afford it).
(b) There were a few direct capital expenditures in 2014 (total value of $263) but the bulk of this was for a complete bike repair tool kit and repair stand that will be amortized over 20 years (i.e. costing $12/year). (See: Actual cycling expenditures prove how cheap cycling can be). It is too complicated to provide actual amortized yearly costs for all of these CapEx spends I've documented, so I've erred on the higher side and will use $50/year as the cumulative amortized CapEx spend.
(c) I didn't use a car for any local trip under 20km in 2014 (including taxis, Uber, etc). I promise there is no cheating involved in these calculations. I really do deliberately bike everywhere I can because I prefer it.
(d) My public transport costs for local trips under 20km in 2014 were $3.58 - a single roundtrip after 6pm on a tram with my girlfriend to a party. The few other trips recorded on my public transport smartcard (Myki) were taken by others (my sister when visiting town, my girlfriend) or were well over 20km (e.g. a train-bike trip to do cherry picking out of town - 30 Nov to Lilydale)2. For 2015, my aim is to keep one Myki reserved for my trips and then show a complete Jan to Dec record that is pure.
(e) So my total local transport costs for 2014 were: $138 + ~$50 (other amortized CapEx spend) + $3.58 = $191.58.

I completed 4,000km on my bike in 2014. So let's compare what I would have spent if I did those 4,000km in a car I owned. I used the Hyundai i20 3 door as the light car example and focused primarily on minimum, required costs.
| Cost Category | Annual Car Costs (4,000km/yr) | My Cycling Costs |
|---|---|---|
| Depreciation | - $1760 to $2160 / year (this is the range for Light Cars calculated by RACV) - Larger cars will cost significantly more | $75 / year (my $380 bike will last at least 5 years) |
| Vehicle Registration | $238 / year (for Victoria) | $0 |
| Compulsory Accident & 3rd Party Insurance | $474 / year (In Victoria: Transport Accident Charge) | $5 / year (I self-insure and will likely never need it) |
| Comprehensive Insurance & Breakdown Cover | $415 / year with $600 excess (Cheapest quote for new Hyundai i20 3 door via Compare The Market) | $0 |
| Services, Repairs, Tyres, Oil | $300 / year (Bottom-end average based on servicing costs for Hyundai i20) | - $58 / year (mostly amortized costs) - No direct costs for 2014. |
| Fuel | - $500 / year (4,000km * 8 cents/km for Hyundai i20) | $0. Extra food was unnecessary. |
| Parking | - $2,200 / year if driving to work and parking in city at early bird rate - $200 / year if parking only occasionally in high-cost areas | $0 |
| Fines | $100 / year (Victoria raises $640 million/year in fines so for the average motorist this is over $200 / year) | $0 |
| Cleaning | $0 / year (Perhaps $40 - $100 / year for the typical motorist) | $0 |
| Permits (e.g. on-street parking) | $0 / year (I have a garage. However, other residents may need permits to park outside their house or at work) | $0 |
| Other: Financing, Leases, Tolls... | ? / year - I've excluded these not because they're insignificant but because they vary considerably. | $0 |
| Total | - Minimum of $4000/year ($6000/year if driving to work and parking in the city) - This cost increases substantially with the price of the car, number of km driven and costs for parking, fines, financing, tolls, etc. | $138 / year |
We can also use the comprehensive aggregate figures compiled by motoring organisations. According to Victoria's largest motoring organisation, the RACV, the lowest Total Standing Costs for a car ("micro cars") available in Australia (for the Suzuki Alto) are $74.71/week = $3,885/year - that's before you ever turn the engine on! The lowest Total Running Costs for any available petrol car aren't materially cheaper than the Suzuki Alto which is 14.17 cents/km. I did around 4,000km on my bike in 2014 so that equals $567. The combined total minimum driving costs to replace my 2014 cycling = $4,452. So my minimum annual saving by cycling rather than driving is $4,452 - $192 = $4,260. See: RACV's car owning and operating costs guide for 2014
If your household owns multiple cars then you can multiply the Total Standing Costs and also factor in that greater car access results in greater mileage and usage (a mythical car-using equivalent of me would actually drive more than 4,000km of local trips a year).

A useful exercise is to take that minimum annual saving ($4,260) and accumulate it over 10 years (I've been car free since 2008 and intend to be for as much of my future life as is feasible). It's easy to do this math yourself with your own figures using any online compound interest calculator. I've used the one on the MoneySmart website and plugged in ultra conservative and simplified numbers. Even so, the minimum 10 year gain is $51,146. When you consider actual household car-related expenses, the long-term financial gains for most households are several hundred thousand dollars. See: Why Mr Money Mustache's biggest secret of financial freedom is to ride a bike
There are various other indirect and optional savings to be had from not owning and using a car and cycling instead. I haven't included them in my comparisons but they are worthy of special consideration as most are hidden costs that car-dependent people are unaware of. These include:
| Other Potential Savings - Cycling vs Driving | Estimate for 4,000km Cycling |
|---|---|
| Exercise costs - gyms, sports, etc. | $300 / year |
| Accessories for car (audio, comfort, racks, wheels, etc.) | $200 / year |
| The value of your time spent on a car: buying/leasing, servicing, repairing, cleaning, doing paperwork, etc. | $500 - $1000 / year |
| Expenditures on goods that are made because you are using a car to get around. E.g. I've never visited a large shopping mall in Melbourne nor a drive-thru nor bought anything spontaneously I couldn't carry using my bike. | $1000 / year |
The costs of public transport are much cheaper than owning and using a car, but they are still more expensive than cycling. In Melbourne, the cheapest method of using public transport as a replacement would be to pay for an annual transport pass (Myki). This would cost $1,430 per year.
Clearly, my actual, annual cycling costs ($192/year) are far cheaper than any transport alternative, especially owning a car (even if I didn't put many km on it). Your cycling costs may be slightly higher (based on different bike and equipment preferences and whether you do your own maintenance) but they can readily be much less than the costs of driving and considerably cheaper than public transport.
2. Transport Time Saved
This is hard to calculate exactly without repeatedly timing the cycling trip versus the car trip (which I typically can't collect). However, personal experience has shown that, if we leave at the same time, I typically beat those travelling by car door-to-door to most destinations within 5-10km unless traffic is very light and parking very easy. Below are estimates of the time saved in 2014:
| 2014 Trip (# per year) | Time by Car (door to door inc. parking)* | Time by Bicycle (door to door inc. parking) |
|---|---|---|
| Work Commute (368) | ~19-23min | 10-12min |
| Weekend Grocery Shop (96) | ~13-16min | 9-10min |
| Brunch/Dinner (~90) | ~10-16min average | 7-9min average |
| Social Destinations (~70) | ~15-20min average | 9-11min average |
| Other Destinations (~60) | ~10-15min average | 7-9min average |
| Transport Time Saved: | ~90 hours saved per year |
Also see: Bikes are faster door-to-door than cars or public transport within 5-10km
3. Wasted Time Saved
Apart from the direct travel time inefficiencies of driving (congestion, parking), there are many indirect ways in which driving wastes time compared to cycling. I have summarised many of these here: The many ways cycling saves time compared to cars and public transport. I have made rough annual estimates of this wasted time in the table below.
However, the biggest two areas of indirect time saving are from: (a) Exercise - the time you spend cycling is exercise that if you were commuting by a passive means you would need to obtain elsewhere; (b) Earning the extra costs of driving - even if you're happy to spend an extra $5000/yr on a car you'll need to spend time working to earn this money.
| Time Category | Estimate for 4,000km Cycling |
|---|---|
| Exercise | - For 4,000km at 20km/hr = 200 hours spent cycling which wasn't wasted as it was exercise. - If these 200 hours were spent on passive transport to get the equivalent exercise would require at least an extra 200 hours. |
| Fuel Stops | ~50 stops * 6min = 5 hours / yr |
| Servicing | 2 services * 1.5 hours = 3 hours / yr |
| Registration, Insurance, Other Paperwork | ~5 hours / yr |
| Cleaning | ~3 hours / yr |
| Permits or Parking Arrangements | ~2 hours / yr |
| Accidents & Breakdowns | ~4 hours / yr (annual pro-rata average) |
| Waiting for Others (e.g. passengers, sharing car) | ~3 hours / yr |
| Purchase, Lease or Sale | ~6 hours / yr (annual pro-rata average) |
| Fines or Penalties | ~2 hours / yr |
| Earning the Extra Costs | $5000 / $60/hr wage = 80 hrs per year |
| Wasted Time Saved: | ~313 hours saved per year |
4. Trip Convenience Satisfaction
I have claimed 99% as an estimate for 2014. Obviously this is just an estimate rather than a calculation as I haven't counted and rated each individual trip. However, in thinking over my 2014 trips, I can't think of any trips where I would have preferred to use a car or public transport than cycle.
Note: This satisfaction level typically rises with experience and as you refine the efficiency, comfort and flexibility of your cycling trips.
5. Safety
In 2014, I once again had zero accidents, injuries or near misses (same as for 2013). Please see my accident history log for precise details: Actual cycling accident history proves how safe it can be. Clearly, cycling several hundred trips and 4,000km in Melbourne does not have to involve any accidents with cars, doorings or crashes due to wet or slippery surfaces. It certainly doesn't have to involve any injuries.
From a subjective safety standpoint: I now almost always feel safer riding a bike than travelling in a car, especially if others are driving. On my bike I feel in complete control of the risks and, given where and how I ride, I consider them negligible.
6. Health
In 2014, I once again had zero health issues, sick days or doctor visits (same as for 2013). My health has always been very good but it is worth noting that over the last 6 years of cycling regularly I have had no illnesses, sick days or doctor visits. Nor have I taken any medicine or supplements (excluding a few aspirins for hangovers). My current BMI is 22 and very stable which compares pretty favourably with people of a similar age (born in 1975) and background.
Naturally, one can't claim that daily cycling will be a remedy for all existing health issues, but it is fair to say that the daily exercise that cycling for transport provides can be a significant contributor to maintaining good health. See: Built-in exercise is a major benefit of cycling for transport
There may also be some benefit in limiting one's daily exposure to airborne illnesses like colds or the flu on public transport.
7. Trip Enjoyment Rating
I have claimed 99% as an estimate for 2014. Obviously this is just an estimate rather than a calculation as I haven't counted and rated each individual trip. However, in thinking over my 2014 trips, I can't think of any trips where I would have enjoyed using a car or public transport more than cycling.
Because I have ready access to reasonably comfortable and efficient public transport for most common trips (e.g. my work commute would be a straightforward tram ride and take only 5-10min longer), another good measure of my cycling trip enjoyment is how many times I chose to use public transport instead. In 2014, there were zero instances where I opted to use public transport rather than ride.
It is interesting to note that I used to switch to public transport from cycling due to wet weather conditions more readily in the past but now that I have a rain jacket, use a rain radar app and feel confident riding in the wet, I almost never switch. I have also learnt to deal with hot and windy weather and, over time, have found it more comfortable and enjoyable to cycle in a broad range of weather conditions.
See:
> How to avoid getting wet when riding
> Solve the sweat problem without showers and changing clothes
> How to deal with windy conditions and still get around by bike
8. Trips under 20km I chose not to cycle
There was only one local trip (i.e. under 20km) in 2014 that I chose to use public transport for rather than ride and that wasn't my preference (I'd have ridden on my own). My girlfriend and I went to a nightime party around 15km away and she was dressed up and didn't want to ride. Of course, there's nothing at all wrong with using public transport when it makes sense and is strongly preferred by yourself or your family/friends.
The major category of trips to watch out for in such calculations like these are the trips that don't happen because cycling has some obstacles that need to be overcome. In this case, limiting yourself to cycling would be reducing your access and urban freedom not extending it. The only real impediment to taking a trip by bike for me is the weather. I would definitely keep an accurate count of such trips I opted not to take if I lived in a very rainy city like Portland or a very snowy or cold city. Fortunately, it doesn't rain much or for long in Melbourne and nor does it get too cold to ride. It's pretty simple to take steps to ensure you are happy to ride all year round. See: How to avoid getting wet when riding. In 2014, there were no trips I can recall that I chose not to take due to it not being pleasant or suitable for cycling.
Further Info:
High cost of commute
Making the Leap-Going Carless: breaking down the numbers


